If you’ve ever planned an event, whether a major conference, a product launch, or a virtual workshop, you’ve likely wondered: How do I really know if this was a success? That’s where event KPIs (key performance indicators) come in.
Tracking the right KPIs isn’t just for big brands with endless resources; it can transform how you plan, execute, and prove the value of your event.
In fact, did you know that over 90% of event professionals use data to measure event success, but only about half feel confident they’re tracking the right metrics? It’s no wonder you’re looking for event KPI, because you want more than a headcount or a generic survey. You want to show real impact and make your next event even better.
This guide breaks down exactly what to track, why it matters, and how to turn data into actionable insights.
Key Takeaways
Event KPIs (Key Performance Indicators) are essential for measuring the success of your event beyond just attendance; they provide actionable insights for improvement.
KPIs differ from basic metrics in that they directly align with event goals like lead generation, brand awareness, or attendee engagement.
Successful events are driven by well-defined KPIs that are tailored to specific objectives and measured at the right time.
Tracking the right KPIs, whether financial, engagement, or satisfaction, ensures you can optimize future events and prove their value.
What Is a KPI in Event Management?

A Key Performance Indicator (KPI) in event management is a measurable value that demonstrates how effectively an event is achieving its key objectives.
KPIs give you concrete, quantifiable data, such as registration numbers, attendee engagement, or ROI. This helps to determine if your event is successful and where there’s room for improvement. In short, KPIs help event organizers focus on the outcomes that matter most.
KPIs and event goals go hand-in-hand. Before you choose any KPIs, it’s critical to define what success looks like for your event. Is it ticket sales, audience participation, sponsor engagement, or something else? Each event type, product launches, networking mixers, and educational seminars will have unique objectives.
KPI vs. Metrics: Key Differences
It’s easy to confuse KPIs with metrics, but there’s an important distinction:
KPIs are the critical few indicators directly connected to your event’s success or failure. They are your primary measures for evaluating goal achievement. Think of it lie “percentage of qualified leads generated” or “net promoter score.”
Metrics can be any data point you collect about the event (like website visits, social media likes, etc.), but not all metrics are KPIs. Only those metrics that directly reflect your event’s most important objectives become KPIs.
Put simply, All KPIs are metrics, but not all metrics are KPIs. Focusing on KPIs keeps you from getting lost in data that doesn’t actually matter to your event’s core aims.

Next, you’ll learn how defining your event KPIs at the right time ensures clear, measurable goals and aligns your team towards achieving them.
When & How to Define Your Event KPIs?
Defining your event KPIs at the right time and with the right input is key to accurately measuring your event’s impact. Setting actionable, tailored KPIs before your event keeps your team focused and ensures every effort is aligned with your goals.
Step | When to Do It | How to Approach | Why It Matters |
Set KPIs Early | Pre-event planning stage | Define KPIs as you set goals, budgets, and timelines | Ensures KPIs align with event objectives from the start |
Involve Stakeholders | Before KPIs are finalized | Gather input from team members, sponsors, and key stakeholders | Builds buy-in, ensures KPIs are relevant to all parties |
Make KPIs Actionable & Measurable | As you define each KPI | Use the SMART criteria: Specific, Measurable, Achievable, Relevant, Time-bound | Enables clear tracking and evaluation |
Tailor KPIs to Event Type & Goals | During goal-setting and KPI selection | Choose KPIs that match your event (virtual, hybrid, in-person) and objectives | Keeps measurements directly relevant and actionable |
Set Time Frames for Each KPI | When creating the KPI list | Assign milestones (e.g., 20% registration growth in 6 months) | Provides benchmarks and tracks progress over time |
Also Read: A Complete Guide On How to Plan an Event
Once you’ve clearly defined your event KPIs and aligned them with your goals, the next step is choosing which specific indicators matter most for your unique event. KPIs aren’t one-size-fits-all.
Categories Of Event KPIs
Event KPIs fall into clear, practical categories that help you track exactly what matters, from audience turnout to engagement, financial outcomes, and beyond.
Understanding each category will help you to zero in on the right metrics for your event type and goals, ensuring your reporting is meaningful and actionable.
Here are the main categories of event KPIs you should know:
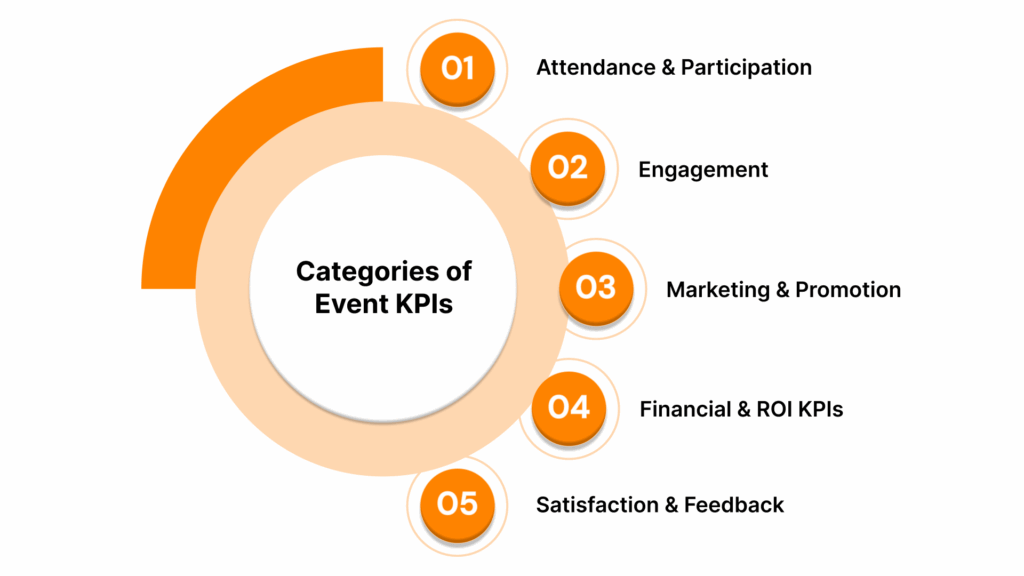
Attendance & Participation
Engagement
Marketing & Promotion
Financial & ROI KPIs
Satisfaction & Feedback
1. Attendance & Participation KPIs
Attendance and participation KPIs provide a foundational understanding of how effectively your event attracts the right audience and keeps them engaged from the very start.
These numbers reveal patterns in audience behavior, help diagnose areas where engagement drops, and guide your planning for future events.
Let’s see why each of these KPIs matters and what insights they offer:
KPI | What It Measures | Why It Matters |
Event Registration Numbers | Total number of registered participants | Gauges initial interest and marketing effectiveness |
Event Attendance Rate | Percentage of registrants who actually attend | Reflects event appeal and communication success |
Event Check-in Rate | Proportion of attendees who actively check in (onsite or online) | Indicates true participation and aids in logistics planning |
No-Show Rate | Percentage of registrants who do not attend | Highlights drop-off and areas for pre-event engagement improvement |
Drop-off Rate (Early Exit) | Ratio of attendees who leave before event concludes | Reveals pain points or content/schedule issues |
Returning Attendees | Number or percentage of participants from previous events | Signals brand loyalty and consistent value delivery |
Average Session Attendance | Mean number of attendees present in each session | Identifies popular time slots or topics |
Session Attendance by Track/Topic | Breakdown of attendance per session or thematic track | Shows which topics or formats resonate most with your audience |
2. Engagement KPIs
Engagement KPIs move past simple attendance and dive into how actively your audience participates during your event. These metrics reveal whether people are simply taking up space or genuinely connecting with your content, your speakers, and each other.
Tracking the right engagement KPIs helps you identify what sparks meaningful involvement and where you might want to improve interaction in future events.
KPI | What It Measures | Why It Matters |
Live Poll Participation Rate | Percentage of attendees responding to live polls | Gauges real-time audience involvement and interest in key topics |
Q&A Participation Rate | Number or % of attendees participating in Q&A sessions | Shows the depth of audience curiosity and willingness to interact publicly |
Survey Response Rate | Ratio of participants who complete post-session surveys | Indicates willingness to provide feedback and overall event engagement |
Audience Poll Results | Outcomes of instant polls during sessions | Offers direct insights on opinions, needs, or preferences |
Chat Activity (Messages Sent) | Volume and frequency of chat messages | Reflects active engagement and networking, especially in virtual formats |
Number of Questions Asked | Total questions submitted throughout the event | Signals high engagement and interest in the material or speakers |
Average Dwell Time (Time Spent in Sessions) | Average minutes spent in each session | Longer times suggest relevant and compelling content |
Page Views per Session / Engagement Depth | How often attendees interact with resources or session content | Measures depth of interaction and content consumption |
Mobile App Downloads / Usage | Number of app installs and usage statistics | Indicates adoption of event tools and willingness to explore event features |
Number of Networking Matches/Meetings | Frequency of attendee networking, matchmaking, or meetings | Tracks professional relationship-building and peer-to-peer engagement |
Speaker Engagement Score | Composite rating of speaker-audience interactivity | Evaluates how well speakers encourage participation and foster connection |
Session Feedback Scores/Ratings | Attendee ratings on individual sessions | Provides detailed input on session quality, energy, and relevance |
3. Marketing & Promotion KPIs
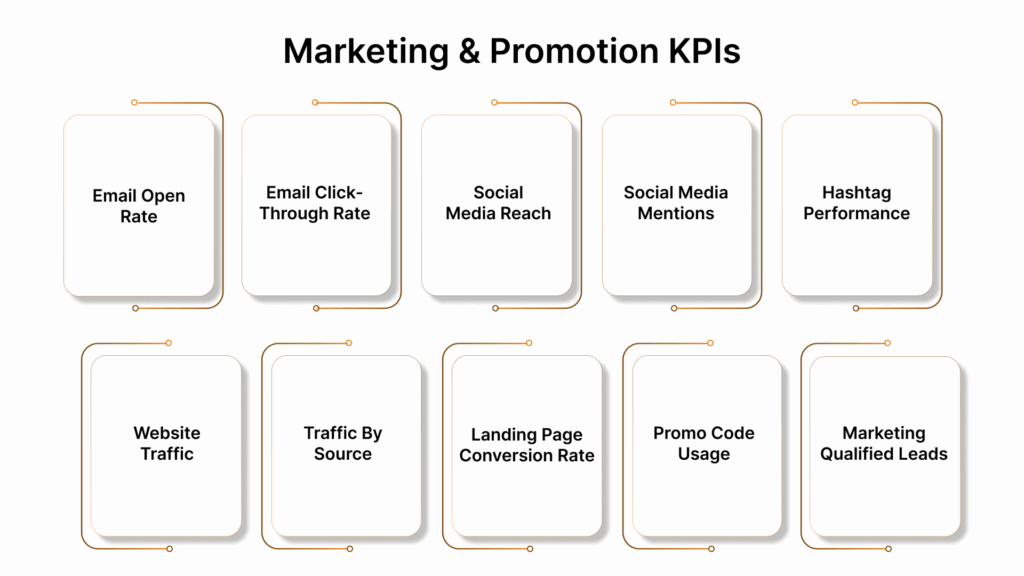
Marketing & Brand KPIs in event move beyond counting heads and start showing you how your event message actually resonates in the digital world.
When you track these measures, you aren’t just checking boxes; you’re uncovering signals about your messaging strength, your ability to attract and nurture leads, and how your event performs across every branded touchpoint.
1. Email Open Rate
This is often the first indicator of whether your event communication is resonating with your audience. A strong subject line, sender reputation, and delivery timing all impact whether people even open your invitation or reminder emails.
Low open rates = a messaging issue at the top of the funnel.
2. Email Click-Through Rate
Getting someone to open your email is one thing; getting them to act is another. This metric tells you how compelling your content and calls-to-action are. Whether it’s a “Register Now” button or a speaker lineup link, the click-through rate indicates how effectively your emails are converting interest into intent.
3. Social Media Reach
This measures how many people see your content across platforms. A high reach indicates that your posts are being pushed algorithmically, often thanks to quality content or strong engagement. It’s not about vanity; it’s about brand visibility and audience expansion in the right spaces.
4. Social Media Mentions
Mentions reflect who’s talking about your event online. This includes direct tags, comments, retweets, and mentions from attendees, speakers, sponsors, or partners. A spike in mentions often happens during key campaign moments like speaker announcements or live event days and provides organic amplification.
5. Hashtag Performance/Usage
Your event hashtag acts like a digital footprint. Tracking how often and widely it’s used helps you measure awareness and engagement in real time. Strong hashtag performance means your brand is earning mindshare and becoming part of the conversation.
6. Website Traffic
Your event website is where curiosity becomes commitment. Monitoring traffic, especially during promotional pushes helps you see what’s working. That blog post or influencer mention that sent hundreds of visitors? Website data will catch it.
7. Traffic by Source (Organic, Paid, Referral, etc.)
It’s not just about how much traffic, but where it’s coming from. By splitting traffic into sources: search engines, email, social media, and paid ads, you uncover which marketing channels are most effective. This helps you optimize budget and focus for future campaigns.
8. Landing Page Conversion Rate
You’ve attracted traffic, now what? Conversion rate shows how many of those visitors take action: registering, signing up, or downloading. This is where content clarity, visual hierarchy, and seamless UX make a direct impact. A high bounce rate with low conversion is a red flag.
9. Promo Code Usage
If you’re using promo codes from partners, email campaigns, or influencers, tracking their usage reveals which relationships or channels are actually driving conversions. It’s a useful KPI for assessing strategic promotions and offers.
10. Marketing Qualified Leads (MQLs)
If you’re running B2B events or demand-gen campaigns, identifying Marketing Qualified Leads (MQLs) is crucial. These are individuals who’ve taken valuable actions: filled out forms, engaged with specific content, or matched your ideal customer profile. MQLs turn high-level interest into measurable sales potential.
4. Financial & ROI KPIs
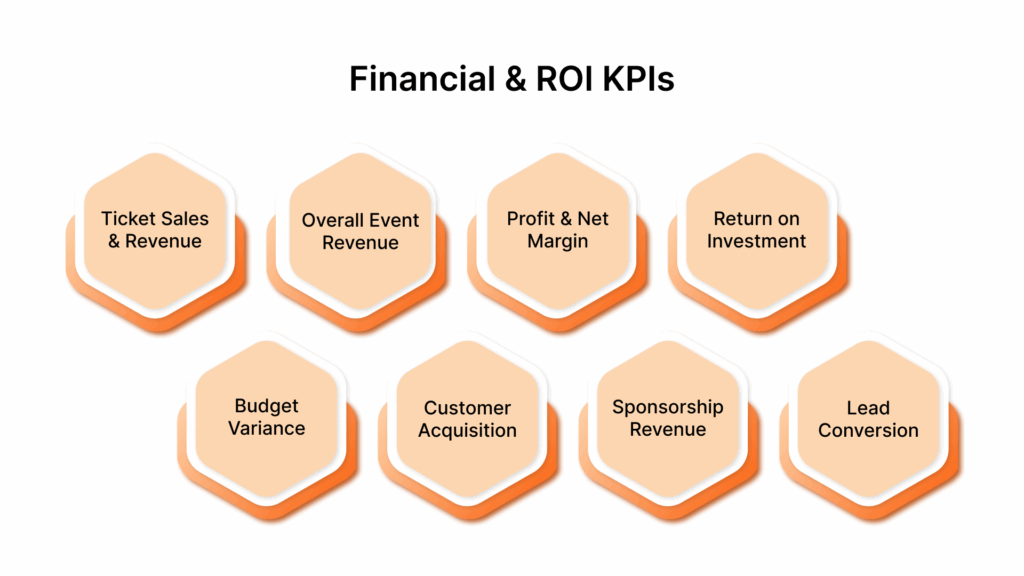
Financial and ROI KPIs cut to the core of event success: Are your investments paying off, and what’s the real financial return? These indicators help planners and stakeholders see past surface numbers to gauge cost efficiency, income generation, and the overall profitability of the event.
1. Ticket Sales & Revenue
The foundation of any event’s financial picture is the total revenue generated from ticket sales. Break this down by ticket type: such as early bird, VIP, or virtual passes, to spot purchase trends and identify your best-performing offers. Consistent growth in sales not only reflects strong demand but also validates your pricing and promotion strategies.
2. Overall Event Revenue
Total event income includes not just tickets, but also sponsorships, merchandise, exhibitor fees, and other sources. A broad view of revenue streams gives you a complete sense of your event’s financial health and can highlight which areas contribute most to your bottom line.
3. Profit and Net Margin
Beyond gross revenue, it’s crucial to subtract expenses (venue, technology, staff, marketing, etc.) to reveal true profit or net margin. This is where you see whether your event was a financial win, margin helps you gauge cost control and smart resource allocation, not just income.
4. Return on Investment (ROI)
ROI takes center stage for long-term planning. It compares your net profit to total costs, answering the critical question: For every dollar spent, how much was returned? A high ROI validates your approach and supports funding for future initiatives, while a low ROI signals a need for sharp pivots in budgeting, marketing, or programming.
5. Budget Variance
Comparing the planned budget to the actual spend uncovers areas where you overspent or underspent. This KPI is invaluable for post-event analysis, helping you refine forecasting accuracy and justify investments to internal teams or sponsors.
6. Cost per Customer Acquisition
When your event is geared toward lead generation or sales, tracking how much you spend to acquire each new customer matters. This KPI helps weigh marketing efficiency against actual business results, if your acquisition cost climbs higher than your average customer value, it’s time to optimize channels or offers.
7. Sponsorship Revenue
Sponsorships often make up a significant portion of event income, especially for large or business-focused gatherings. Monitoring sponsorship revenue, alongside fulfillment of sponsor packages ensures you’re delivering promised value and cultivating sustainable partnerships for future events.
8. Lead Generation & Conversion
Quantifying the number and eventual conversion of leads generated during your event is essential for events where business growth is the end goal. Tracking the sales funnel beyond the live event demonstrates your true revenue potential and helps you prove impact to both internal stakeholders and external partners.
5. Satisfaction & Feedback KPIs
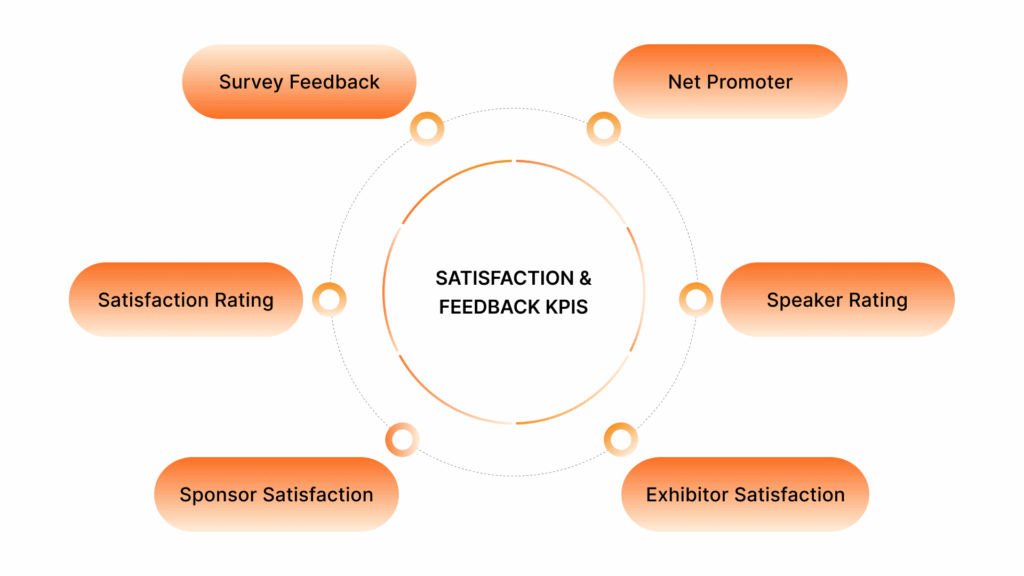
Satisfaction and feedback KPIs shed light on how your event was perceived by everyone involved: attendees, speakers, sponsors, and exhibitors. These measures provide direct voices from your audience, blending quantitative scores with qualitative insights. They not only highlight your strengths but also reveal opportunities to elevate future experiences.
1. Post-Event Survey Scores
Survey feedback offers a broad snapshot of attendee sentiment. A high response rate paired with focused questions provides actionable insight into content quality, logistics, and overall experience.
2. Net Promoter Score (NPS)
This single question: “Would you recommend this event?” reveals attendee loyalty and likelihood of driving word-of-mouth. A high NPS indicates a strong, memorable experience; a low one points to deeper issues.
3. Attendee Satisfaction Rating
Usually collected through surveys or app ratings, this score reflects overall audience enjoyment. It’s a quick way to gauge whether your event met expectations.
4. Speaker Score / Rating
Based on session feedback and engagement levels, this measures how well speakers connected with the audience. It informs future speaker selection and coaching.
5. Sponsor Satisfaction Rating
Key for partnerships, this score shows whether sponsors feel they received value for their investment, especially in terms of visibility and lead quality.
6. Exhibitor Satisfaction Score
Important for expos and trade shows, this score reflects how exhibitors felt about foot traffic, booth support, and outcomes. High scores encourage repeat participation.
Next, let’s look at how to choose the right KPIs to ensure your event goals are effectively measured.
Also Read: The Strategic Value of Swag Bags in Event Planning
How to Choose the Right KPIs for Your Event?
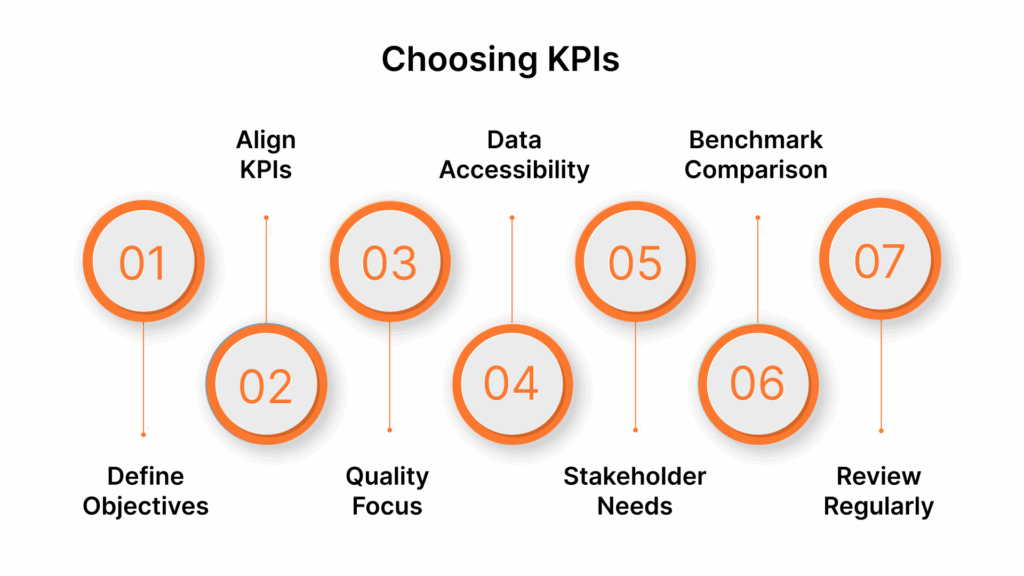
The right event KPIs are tied directly to your goals and give you actionable insights, rather than vanity metrics, so your evaluation is both meaningful and effective.
1. Clarify Your Event Objectives
Start by asking: What does success look like for this event?
Is your goal brand awareness, lead generation, education, networking, or revenue?
Different events (conferences, workshops, expos, or virtual summits) have distinct priorities.
Tip: Outline 2–3 main objectives to keep your KPI focus sharp.
2. Align KPIs With Goals
Every KPI you choose should map directly to at least one event objective.
For awareness: Social media reach, website visits, and hashtag usage are powerful indicators.
For engagement: Track poll participation, dwell time in sessions, or chat activity.
For revenue: Consider ticket sales, sponsorship payments, and cost per lead.
For learning: Use outcomes from quizzes, session feedback, or certification rates.
3. Prioritize Quality Over Quantity
It’s tempting to track everything, but too many KPIs dilute focus and create reporting overload.
Choose KPIs you can reliably measure and that offer real insight.
Aim for a balanced set: a few for engagement, a few for financials, a few for satisfaction.
4. Consider Measurability and Data Accessibility
Only select KPIs for which you have the tools and systems to collect accurate data.
For virtual events, platforms should provide analytics on engagement and attendance.
For in-person events, ensure you have systems for check-ins, surveys, and feedback.
5. Factor in Stakeholder Needs
Who will use the KPI data: sponsors, internal teams, or executives?
Match metrics to questions your stakeholders ask most, such as ROI, lead quality, or attendee satisfaction.
Discuss KPI selection in advance to keep everyone aligned on what matters.
6. Compare to Benchmarks and Past Performance
Where possible, choose KPIs with existing industry standards or your own historical data for context. This helps you interpret results and set realistic targets, not just track data for its own sake.
7. Stay Flexible and Review Regularly
As your event strategy evolves, revisit your KPI set. Drop metrics that no longer serve your goals and add new ones as your needs change. After each event, ask what data provided the most insight and adjust your next round of KPIs accordingly.
Example Approach:
Suppose your event’s primary goal is lead generation, with a secondary focus on brand awareness. You might choose:
Number of new leads and qualified pipeline generated
Cost per lead
Brand recall uplift (via pre- and post-event surveys)
Social media mentions during the event
By narrowing your focus and ensuring a clear link between objectives and KPIs, you make your evaluation process actionable, insightful, and credible to all stakeholders.

Event KPIs in Action with Wiz-Team
For organizations running complex events, tracking the right KPIs is essential, and that’s exactly where Wiz-Team delivers value.
With its powerful Event-Works platform, Wiz-Team enables event managers to define, collect, and analyze key performance indicators across the full event lifecycle.
From registration and accreditation to engagement, learning, and operational efficiency, the platform transforms event data into actionable insights, making KPI-driven decision-making simple, scalable, and strategic.
Let Wiz-Team be your partner in planning events that are not only seamless to manage but also rich in measurable impact!
Conclusion
The real power of event KPIs emerges not in the numbers themselves, but in how they inspire teams to be intentional, with their planning, their execution, and their post-event evolution. When event leaders use these insights to connect strategy with action, every initiative becomes an opportunity for meaningful progress, smarter decisions, and tangible results.
If you’re ready to make every event count and measure what truly matters, let Wiz-Team help you turn those possibilities into reality. Contact Wiz-Team to plan, execute, and optimize your next event.
FAQs
1. How do you choose event KPIs for a multi-day or multi-track event?
For complex events with multiple days or sessions, tailor your KPIs to different tracks or audiences. Use session-specific attendance, engagement per session, and topic-based feedback to understand which elements had the most impact and why.
2. Can event KPIs help improve sponsor satisfaction and ROI?
Yes, you can set KPIs such as sponsor booth visits, branded content engagement, and lead generation from sponsor activations to demonstrate value delivered to sponsors and identify ways to enhance future partnerships.
3. What are some advanced digital engagement KPIs for virtual events?
Track metrics like chat participation, downloads of digital materials, live poll and Q&A responses, virtual networking connections, and dwell time within the digital platform to gauge the depth of attendee involvement in a virtual context.
4. How often should event KPIs be reviewed and updated?
Event KPIs should be evaluated before, during, and after each event cycle. Regular reviews, especially after each event, help you refine what you measure as your goals, technology, and audience needs evolve.
5. How can event KPIs inform marketing and audience targeting for future events?
By tracking which demographics, channels, or campaign messages yield the highest registration, attendance, and engagement rates, you can adjust your marketing strategies and tailor future events to target your most responsive audiences.
#WizJourney