Ever walked out of your own event, wondering, Did any of this really move the needle? Maybe the keynote got applause, your sponsors looked happy, and the Wi-Fi (finally) worked. But what about impact? The kind you can measure, share, and actually be proud of next quarter?
This guide is for planners, marketers, and strategists who seek deeper insights beyond just financial metrics, focusing on the true, lasting impact of their events. It’ll explore beyond the textbook Event ROI calculations.
Wonder where brand affinity, future sales, and those elusive high-potential leads fit in? Every variable finds its place.
If you’ve ever wished you could tell a better event story, one that’s as convincing in the boardroom as it is on the ground, this is for you!
Key Takeaway
Event ROI captures both financial returns and intangible benefits, while ROO measures the achievement of strategic goals.
True Event ROI requires mapping all costs (direct, indirect, hidden) and tracking both immediate and long-term value.
Attribution models help measure the impact of each touchpoint, offering a clearer view of event success.
Technology integration with event platforms and CRMs streamlines data collection, improving ROI accuracy.
What Is Event ROI?

Event ROI (Return on Investment) is the single most important metric for knowing, in plain terms, if an event actually delivered value in terms of revenue, relationships, reputation, or results.
Unlike traditional ROI, which tends to focus strictly on dollars in and dollars out, event ROI accounts for both tangible outcomes (think ticket sales, sponsorships, or contracts signed) and those harder-to-measure results: deeper engagement, strengthened partnerships, stronger brand presence.
That brings us to the concept of ROO. While understanding event ROI is essential, it’s also important to consider Return on Objectives (ROO), which is another key metric that helps capture broader event ROI.
Event ROI vs. ROO
There’s another acronym in play for modern event pros: ROO, or Return on Objectives. While ROI is about quantifiable returns, ROO evaluates how well an event delivered on its stated goals: through innovation, educating teams, or spotlighting a new product.
For some events, ROO can be just as crucial as ROI, and smart planners know how to measure both.
Aspect | Event ROI (Return on Investment) | ROO (Return on Objectives) |
Core Focus | Quantifying financial return (money in vs. money out) | Measuring the achievement of specific event goals, regardless of direct financial outcomes |
Primary Metrics | Profit, revenue, cost savings, ROI percentage | Leads captured, attendee engagement, knowledge transfer, networking, brand awareness, satisfaction scores, etc. |
Typical Calculation | Event ROI (%) = (Gain from Event – Cost of Event) / Cost of Event × 100
| % of objectives met; goal completion rates; qualitative surveys; KPI benchmarks |
Nature of Results | Numeric, monetary, quantifiable | Can be numeric (e.g., NPS), but often qualitative/strategic |
Timeframe of Impact | Often measured shortly after the event, though some effects (e.g., pipeline) can be long-term | May include immediate, mid-term, and long-term outcomes |
Best For | Stakeholders seeking financial justification (CFO, budget owners) | Stakeholders interested in strategic, brand, or mission-related outcomes (CMO, community manager, HR, etc.) |
Example Use | Did our conference generate more revenue than we spent? | Did our conference help us build stronger customer relationships or launch the new product effectively? |
Importance in Planning | Essential for budget allocation and executive approval | Critical for aligning event purpose with organizational vision and stakeholder needs |
Common Data Sources | Financial reports, sales figures, registration/ticketing | Surveys, engagement apps, audience polling, social listening, and qualitative feedback |
With that distinction in mind, let’s explore how to map costs and value for accurate Event ROI calculation.
Also Read: A complete guide on how to plan an event

Cost and Value Mapping for Event ROI
Understanding true event ROI requires a meticulous approach to both mapping all sources of return and accounting for every layer of cost. This section provides detailed checklists and practical guidance to ensure both value and expense are fully captured, while highlighting common pitfalls to avoid.
Detailed Checklist of Direct, Indirect, and Hidden Event Costs
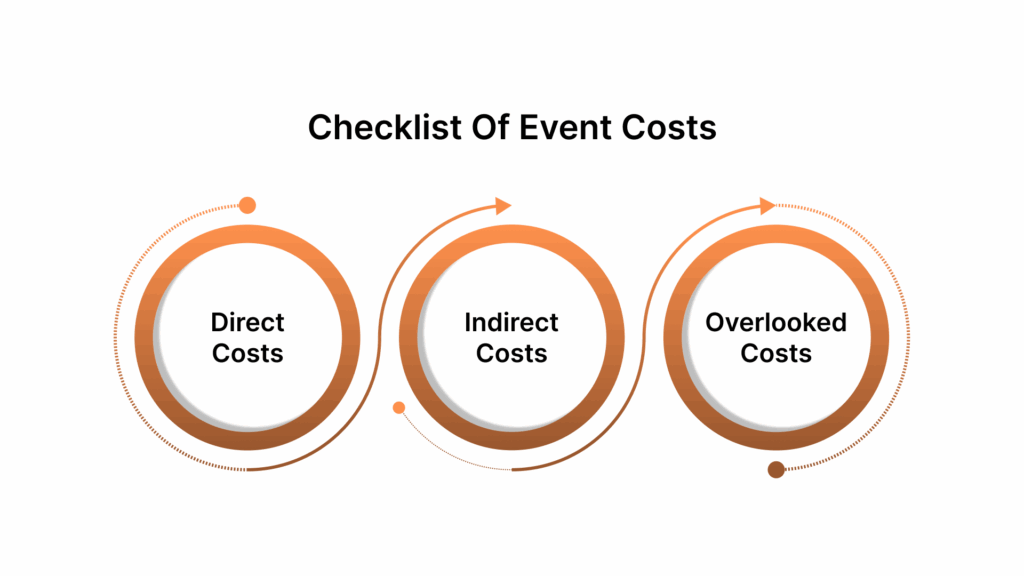
A thorough ROI calculation must account for every investment, seen and unseen. Event costs fall into three main categories:
1. Direct Costs
Venue and facility rental
Catering and food/beverage
AV/Production equipment and technology
Speaker fees and honorariums
Staffing and on-site personnel
Registration platforms or ticketing fees
Marketing, advertising, and promotion
Print materials and event swag
Travel and accommodation for guests or staff
Security and insurance
2. Indirect Costs
Staff planning hours (pre-event coordination and strategy)
Administrative support and project management
Opportunity cost of using internal resources (e.g., senior leadership time)
Post-event reporting and analysis
Ongoing platform/software subscriptions beyond the main event
Internal training to use event tools
3. Hidden or Overlooked Costs
Overtime or temporary staff hires
Setup and teardown labor
Unused catering or supplies (waste)
Last-minute troubleshooting (expedited deliveries, tech fixes)
Post-event storage and shipping
Lost productivity due to event prep or wrap-up
Identifying All Sources of Event Return
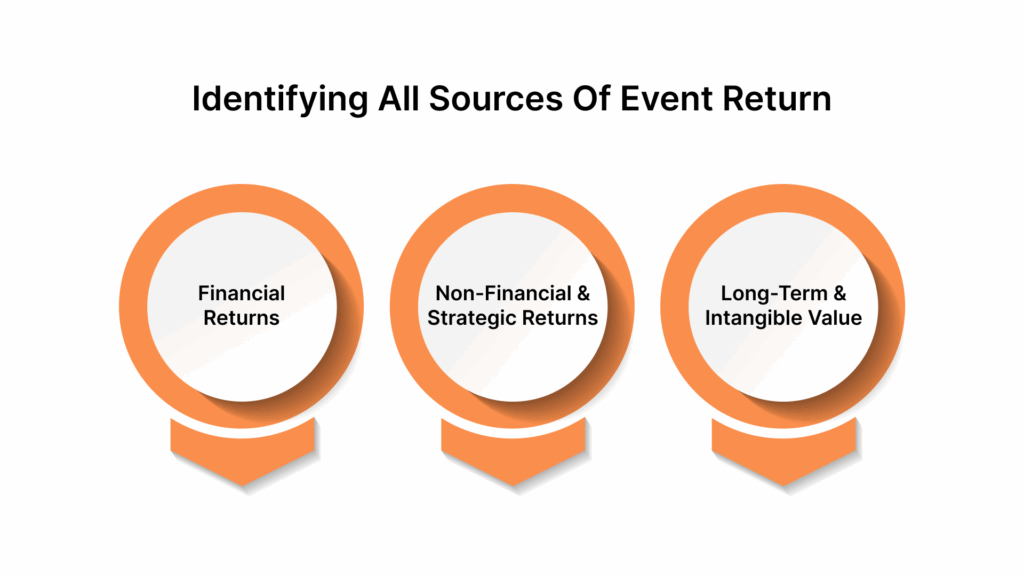
Events create value far beyond immediate revenue. Mapping these returns ensures every benefit, both immediate and future, is recognized:
Financial Returns
Ticket sales and registration fees
Sponsorship and exhibitor income
Merchandise or premium experience sales
Sales pipeline expansion: number and value of qualified leads
On-site or post-event deals and contracts closed
Non-Financial and Strategic Returns
Brand awareness: Media mentions, social reach, website traffic spikes
Attendee engagement: Survey scores, interaction rates, app usage metrics
Learning outcomes: Certifications, knowledge transfer, skills development
Enhanced partnerships: New collaborations, sponsors retained for future events
Speaker and influencer advocacy: Lasting brand influence and advocacy generated by speakers and influencers.
Long-Term and Intangible Value
Customer lifetime value: Projected future spend from new or retained attendees/sponsors
Increased loyalty: Repeat attendance, higher Net Promoter Score (NPS)
Community building: Growth of participant groups, advisory boards, or forums centered around the event’s mission
Actionable data collection: Insights for future targeting, personalization, and continuous improvement
Cost vs. Value: Avoiding Common Measurement Mistakes
Even experienced organizers can stumble over common traps in event ROI evaluation. Here’s how to stay accurate and credible:
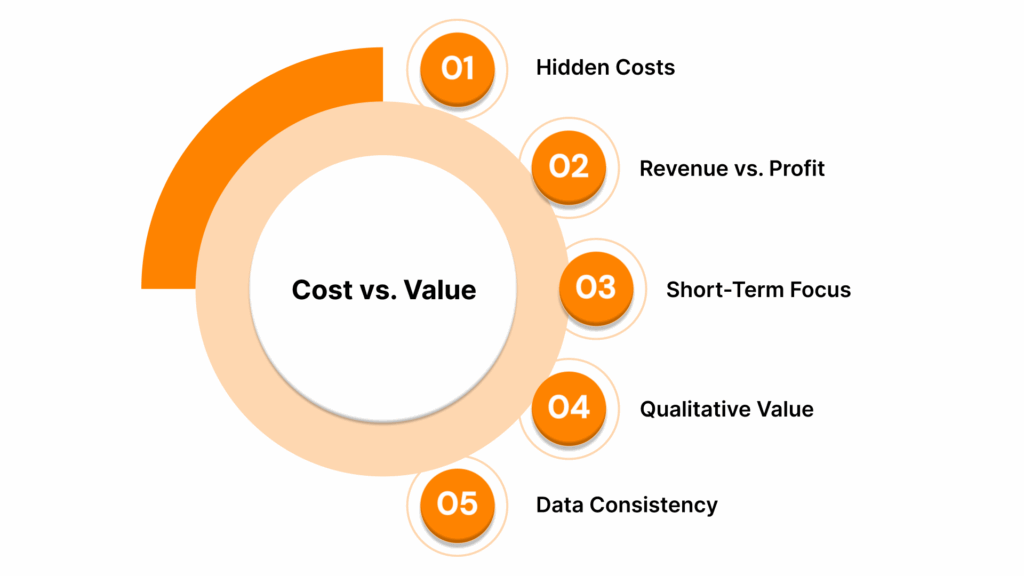
Ignoring Indirect and Hidden Costs: Only tallying visible expenses (like venue or catering) underestimates the true cost. Capture time, opportunity, and sunk costs for a real profit margin.
Confusing Revenue with Profit: Total revenue can look impressive, but only net profit, what’s left after every cost, provides a real measure of return.
Over-focusing on Immediate Returns: Prioritize both short-term (sales, leads) and long-term (loyalty, lifetime value) benefits in your value map. Many event successes appear quarters or years down the line.
Neglecting Qualitative Value: Discounting brand awareness, satisfaction, or learning outcomes can leave crucial value on the table, especially for events where relationships or reputation drive future business.
Inconsistent Data Collection: Standardize how costs and returns are tracked, reported, and compared, ideally through a unified platform or dashboard to prevent double-counting or missed insights.
While cost and value mapping offers a practical way to visualize how resources translate into event impact, understanding the underlying models of event ROI is particularly important.
How to Understand Event ROI Models?
Industry leaders have developed various models to measure Event ROI, capturing both financial returns and intangible benefits. These models offer a more comprehensive view of an event’s value.
Here are the core models for calculating and attributing Event ROI, starting with basic financial models and progressing to more advanced methodologies.
Standard Revenue and Profit Models for Event ROI
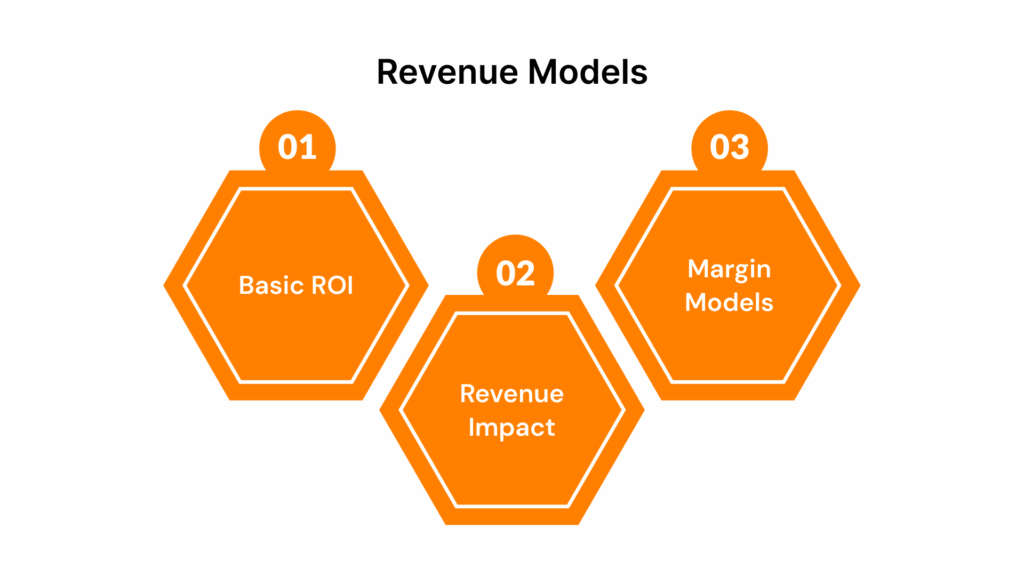
These models provide the most basic framework for measuring Event ROI, focusing on direct financial returns such as revenue and profit. They help evaluate whether the event generated enough income to justify its costs, offering a quick check on an event’s financial health.
1. Basic ROI (Revenue/Expense Model)
The Basic ROI model is the simplest and most widely used way to measure event profitability by comparing total revenue against total costs. It gives a quick, clear percentage indicating whether the event generated more revenue than it cost to run, making it ideal for those focused on financial results and needing an easy-to-understand snapshot of event success.
Formula:
Event ROI (%) = (Revenue – Costs) / Costs × 100
2. Incremental Revenue Model
The Incremental Revenue Model evaluates an event’s true impact by measuring the additional revenue generated specifically because of the event, over and above normal business activity. This approach is especially valuable for recurring events, as it compares actual event revenue against expected baseline revenue without the event, providing a clearer understanding of the event’s unique contribution to growth and financial success.
Formula:
Incremental Revenue = (Revenue from Event) – (Revenue Trend without Event)
3. Gross Margin or Margin-Based Models
The Gross Margin Model takes the Basic ROI Model a step further by considering the cost of goods sold (COGS). This model is particularly relevant for events where physical products or deliverables are involved, such as trade shows, conferences with product sales, or festivals with vendor booths.
Formula:
Gross Margin ROI = (Revenue from Event – COGS) / COGS × 100
This model calculates ROI based on the revenue generated from the event after deducting the direct costs of delivering the products or services (e.g., materials, production costs, or vendor fees).
This approach provides a more nuanced financial picture, helping event organizers evaluate whether the event is generating a healthy margin relative to the costs directly associated with the goods or services sold.
Traditional revenue and profit models build the foundation for measuring event success. However, to truly understand which activities drive results, attribution models offer deeper insights.
Attribution Models for Event ROI
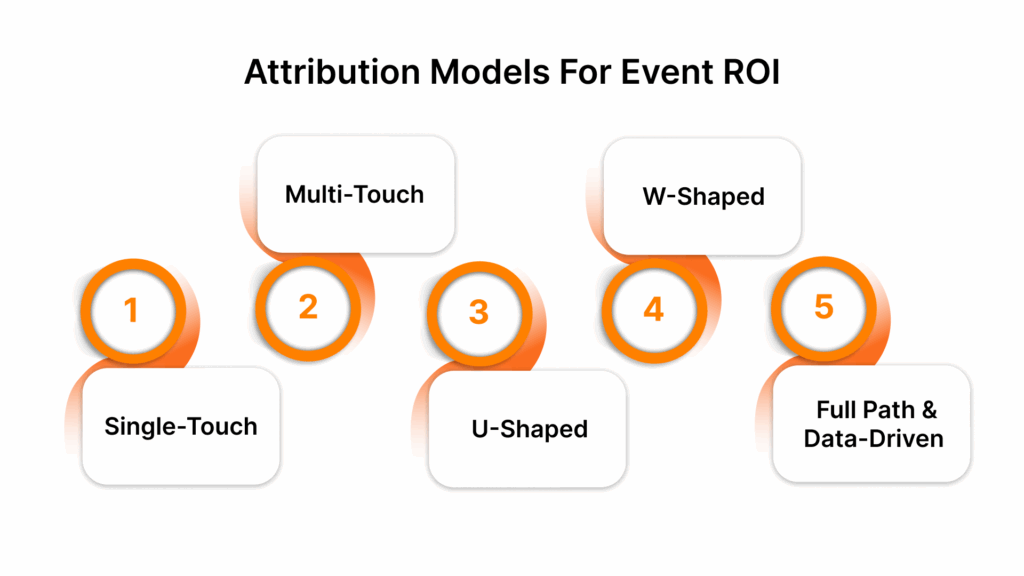
Attribution models measure the impact of every interaction in the event lifecycle, showing how each touchpoint contributes to brand awareness, engagement, lead generation, and sales. This involves the first ad to the post-event follow-up.
1. Single-Touch Attribution Models
Single-touch attribution offers the simplest approach to measuring event ROI by crediting a single, most significant interaction in the attendee or customer journey. This model answers: “Which one moment led directly to this event outcome?”
How It Works
All credit for an event conversion is assigned to one interaction.
That interaction is typically the very first or the very last touchpoint before conversion.
Types of Single-Touch Attribution
Model | Credit Assignment | Ideal For |
First-Touch | 100% credit to the first interaction | Brand awareness campaigns, short cycles |
Last-Touch | 100% credit to the last interaction before the outcome | Action-focused events, quick wins |
First-Touch Attribution: Example
If your team hosts a virtual product launch. An attendee’s journey might look like this:
Sees a LinkedIn ad for your event and clicks to register.
Later, the attendee receives reminder emails and visits your event page several times.
Finally, attend and sign up for a demo during the event.
First-touch attribution would assign all ROI credit: demo sign-ups, pipeline generation, or eventual sales, entirely to the LinkedIn ad. The model assumes the ad was solely responsible for sparking their engagement.
When to Use
Top-of-funnel tracking: When you want to know which promotion started the attendee’s journey.
Net-new lead events: Useful when acquiring new audiences.
Last-Touch Attribution: Example
Using the same virtual product launch scenario described above:
The attendee sees and clicks the LinkedIn ad, registers, receives reminder emails, and visits the event page multiple times.
However, the final action they take before signing up for the demo is clicking a direct link in the reminder email sent the day before the event.
With last-touch attribution, the entire credit for the conversion is assigned to that last interaction, which is the reminder email, because it was the final step that directly led to the demo sign-up.
When to Use
Registration conversion: Prioritizing which message sealed the deal.
Short decision cycles: Quick-turn, action-focused events.
Multi-Touch Attribution Models for Event ROI
Multi-touch attribution models allow event professionals to move beyond simplistic, single-point credit and accurately map how various touchpoints influence attendee conversions, engagement, and overall event ROI.
These models acknowledge that decision-making involves multiple interactions, such as emails, ads, meetings, demos, and follow-ups, each contributing to the journey.
Why Multi-Touch Attribution?
Holistic View: Accurately captures the impact of all event marketing and engagement efforts, not just the first or last.
Smarter Optimization: Identifies which channels and interactions most effectively drive ROI, allowing for better investment and strategy.
Real-World Reflection: Mirrors the actual, non-linear way attendees engage with event content, partners, and promotions.
Here are the multi-touch attribution models for Event ROI
1. Linear Attribution
Each touchpoint gets equal value, regardless of order or perceived influence.
When to Use: When all interactions (emails, demo requests, ad clicks) are of similar relevance.
Example: If an attendee receives three emails and has one call before registering, each gets 25% credit for the registration.
2. Time Decay Attribution
Assigns greater value to touchpoints that occur closer to the conversion. Earlier touches receive less credit.
When to Use: For events with longer decision cycles, where those final reminders or direct engagements often tip the balance.
Example: A person who first saw a social ad a month ago but signed up only after a personal follow-up and a last-minute offer will have more credit given to those later contacts.
3. U-Shaped (Position-Based) Attribution
The first and last significant touches (e.g., initial ad and final registration push) get the majority of credit, typically 40% each; the remainder is split among intermediates.
When to Use: When both the initial “spark” and closing interaction are critical in the event conversion path.
Example: First webinar invite and last “register now” email each receive major ROI weighting, with website visits and social engagements in between sharing the rest.
4. W-Shaped Attribution
Credits the first, a key middle, and the final touchpoint, often at 30% each; leftovers are divided among other interactions.
When to Use: Multi-stage B2B or large-scale events where lead generation, nurturing, and final registration are all critical.
Example: An attendee’s journey: social ad click (30%), lead magnet download (30%), actual registration (30%), with other touches sharing the final 10%.
5. Full Path & Data-Driven Attribution
Every significant touchpoint (sometimes including post-registration engagement) is weighted based on historical data, AI, or unique business rules. This model adapts to real outcomes and complex journeys.
When to Use: Enterprises with mature data capabilities and events where attendee actions span across long periods and multiple channels.
Example: Machine learning identifies that in-person touchpoints are most predictive of future purchases, so these are given the most credit.
Tips for Implementation
Map the attendee journey: List every touchpoint from the first invitation to the last follow-up.
Assign the right model: Choose based on event type, attendee behavior, and objective (brand, revenue, retention, etc.).
Iterate over time: Analyze outcomes and adjust attribution logic to reflect evolving engagement patterns.
Multi-touch attribution transforms event ROI from guesswork into data-driven strategy, ensuring every engagement is accurately recognized and optimized for maximum impact.
Hybrid/Advanced Attribution Models (Algorithmic & Data-Driven)
Hybrid and advanced attribution models combine multiple approaches (e.g., first/last-touch, multi-touch, and data-driven insights), allocating credit across all online and offline touchpoints in an attendee’s journey.
How Hybrid Attribution in Practice
Component | Description | Typical Methods |
Baseline Model | Initial multi-touch or position-based rules | Linear, U-shaped, last-touch |
Self-Reported Data | Customer survey or qualitative input to inform weighting and channel mix | Direct post-event feedback |
Algorithmic Layer | Machine learning or advanced analytics for dynamic weight assignment | Regression, predictive analytics |
Offline Channels | Integration of activities not digitally tracked | Manual entry, survey data |
Incrementality Test | A/B or experimental design to measure specific channel lift | Holdout groups, randomized tests |
Practical Example:
An attendee sees a social ad, hears a podcast mention, attends a live event, and is referred by a peer. A hybrid model splits credit (using tracking + survey feedback + analytics) among all these steps, reflecting what actually influenced registration or purchase.
Benefits:
Captures the full buyer journey: digital, in-person, and word-of-mouth.
Provides more accurate insights for optimizing marketing spend and event strategy.
Allows for tailored measurement: you can adjust weightings as more data comes in.
Best For: Large, data-driven organizations or complex events where multiple touchpoints (both tracked and offline) drive ROI.
To make these ROI models work, you need quality data and the right technology. Next, let’s see how smart data collection and tech integration drive truly ROI-focused events.
Data Collection and Tech Integration for ROI- Driven Events
Comprehensive event ROI hinges on tracking the right data and connecting every insight with technology that enables rapid, unified analysis. Here’s how to level up your event measurement strategy:
What to Track for Superior ROI Insights
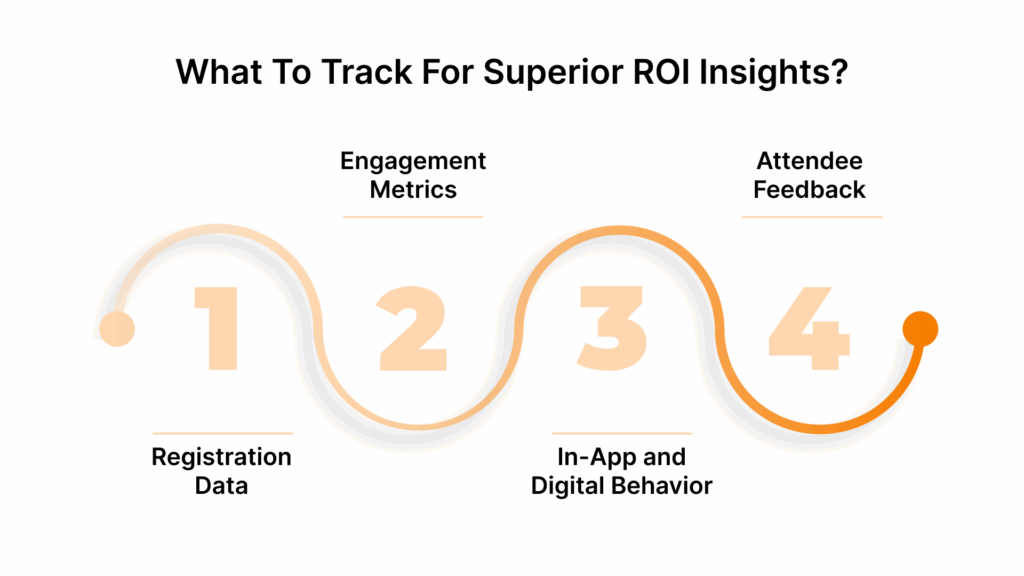
1. Registration Data
Total and segmented registrations (by role, company, source, ticket type)
Registration conversion rates (site visits to sign-ups)
Profile completion and demographic details
2. Engagement Metrics
Session attendance and drop-off rates
Time spent per attendee within specific sessions or zones
Interactions: chat messages, Q&A participation, poll/vote responses
Networking activities, business card exchanges, and booth visits
3. In-App and Digital Behavior
Mobile app downloads, logins, and feature utilization
Clickpath and heatmap analysis within event apps
Content downloads (presentations, whitepapers)
4. Attendee Feedback
Real-time session and event ratings
Post-event surveys: NPS, satisfaction scores, open-ended responses
Sentiment analysis from social channels or app comments
Tools and Platforms for Seamless Data Integration
Category | Example Tools & Technology | Measurement Capabilities |
Event Management Software | Registration, check-in, session tracking, native analytics, real-time dashboards | |
CRM Systems | Salesforce, HubSpot | Lead capture, pipeline attribution, multi-touch ROI integration |
Analytics Platforms | Google Analytics, Tableau | Web behavior, advanced data visualization, cohort/performance analysis |
RFID/NFC Solutions | Poken, Zoho RFID | Real-time attendee movement, booth visits, dwell time, hands-free engagement |
Mobile Event Apps | In-app interaction, gamification, live engagement, instant feedback collection |
To turn powerful data collection and technology integration into real, measurable results, it’s crucial to choose a solution that delivers both reliability and adaptability for your events. This is where Wiz-Team comes in.
Also Read: Technology, growth and legacy: Take-aways from Wiz-Team’s annual offsite
How Wiz-Team Makes Event ROI Measurement Easy and Effective
When running events, gathering data from different sources: registrations, attendee check-ins, surveys, and engagement metrics, it can get messy and overwhelming. Often, information is scattered across several spreadsheets or platforms, which makes it hard to see the full picture of what’s actually working and what’s not.
Wiz-Team makes this process simple.
How Does Wiz-Team Help, Really?
Unified Data Capture: Event-Works links every touchpoint, from registration and on-site activity to session engagement and survey feedback, within one platform.
Real-Time Dashboards: Organizers, sponsors, and stakeholders access instant analytics and visual reports, making ROI insights easy to understand and share.
Automation: Tools like badge scanning, mobile app engagement, and integrated CRM syncing eliminate manual data work, making measurement more efficient and less error-prone.
Case Study: Birmingham Common Wealth Games 2022
Birmingham 2022 Commonwealth Games used Wiz-Team’s Event-Works Platform to transform event operations. Over 130,000 registrations were processed and 90,000 accreditations issued, enabling nearly 1 million secure entry point scans across 20 sports and 280 events. This resulted in substantial improvements in operational efficiency, security, and real-time participant tracking.

Conclusion
To effectively report and communicate event ROI, focus on what matters most to stakeholders by linking event activities to tangible business outcomes. Blend key metrics like revenue or attendee satisfaction with real stories that highlight impact. Use clear visuals and dashboards to make data accessible, and always be transparent about both successes and areas for improvement.
Explore Wiz-Team’s Event-Works platform today and experience the clarity, efficiency, and strategic insight that empower your team, before, during, and after every event.
Take the next step toward smarter, more impactful event management!
FAQs
1. What does event ROI actually measure?
Event ROI measures the value gained from an event compared to the resources invested in running it. This includes both financial returns (like revenue from ticket sales and sponsorships) and non-financial benefits (such as brand visibility, customer engagement, and strategic partnerships).
2. Is event ROI only about profit or revenue generated?
No, event ROI goes beyond just profit or revenue. It can encompass metrics like new leads, brand awareness, attendee satisfaction, networking opportunities, and long-term relationships developed as a result of the event.
3. How often should I measure and report on event ROI?
Event ROI should be measured at multiple stages: pre-event (for goal-setting and projections), during the event (real-time engagement tracking), and post-event (final outcomes and long-term impact). Reporting frequency depends on stakeholder needs but should include a comprehensive summary shortly after the event and a follow-up for long-term results.
4. What are some common challenges in measuring event ROI?
Common challenges include fragmented data across multiple tools, difficulty attributing results to specific event activities, quantifying intangible benefits, and tracking long-term outcomes that may not show up immediately after the event.
5. Can technology make event ROI measurement easier?
Yes, integrated technology makes event ROI measurement significantly easier by automating data collection, centralizing analytics, and providing real-time insights. Modern platforms handle everything from attendee engagement tracking and session analytics to lead capture and post-event feedback, reducing manual work and making results far more accurate and actionable.
Looking to simplify and strengthen your event ROI measurement? See how Wiz-Team’s Event-Works platform can deliver reliable, comprehensive insights for your team, every step of the way.
#WizJourney