After months (or even years) of preparation, events often leave organizers with a mountain of data: attendee feedback, engagement metrics, social media metrics, and more. But what happens next? It’s post-event analysis. It is one of the most powerful tools in the event planner’s toolkit.
It is the process of learning, improving, and proving the value of your efforts.
Event management can be overwhelming, filled with unpredictable twists and countless moving parts. But you deserve to feel confident, knowing that your next event will be even better than the last.
By the end of this guide, you’ll discover exactly how to turn results into actions, making your post-event analysis the most powerful tool for improvement.
At a Glance
Post-event analysis helps evaluate event success and informs strategies for future improvements.
Setting clear, measurable goals and collecting both quantitative and qualitative data is key to gaining actionable insights.
Analyzing performance, feedback, and ROI reveals successes, challenges, and areas for improvement.
Presenting the findings with visuals and structure ensures clarity and drives informed decisions for future events.
What Is Post-Event Analysis?

Post-event analysis is a deliberate and structured evaluation conducted after an event concludes. Its purpose is to assess how effectively your event achieved its goals by examining key data and feedback.
It is the reflective phase that follows the live event, closing the loop by measuring performance against objectives.
The core of post-event analysis rests on three essential components:
Performance Metrics: Hard data such as attendance numbers, engagement levels, budget adherence, and operational results provide a quantitative measure of success.
Feedback: Direct input from attendees, sponsors, staff, and social media offers context and nuance to the numbers, revealing perceptions, satisfaction, and areas needing attention.
Return on Investment (ROI): This assesses the value gained relative to resources
Understanding what post-event analysis is sets the stage for a more focused evaluation. However, to make this process truly impactful, it’s crucial to first establish clear event goals.
Setting Event Goals for Effective Post-Event Analysis
Well-defined goals act as benchmarks for success. They tell you what to measure, how to measure it, and when you’ve truly made an impact. Without them, you’re left relying on assumptions instead of insights.
Key Event Goals to Define Upfront:
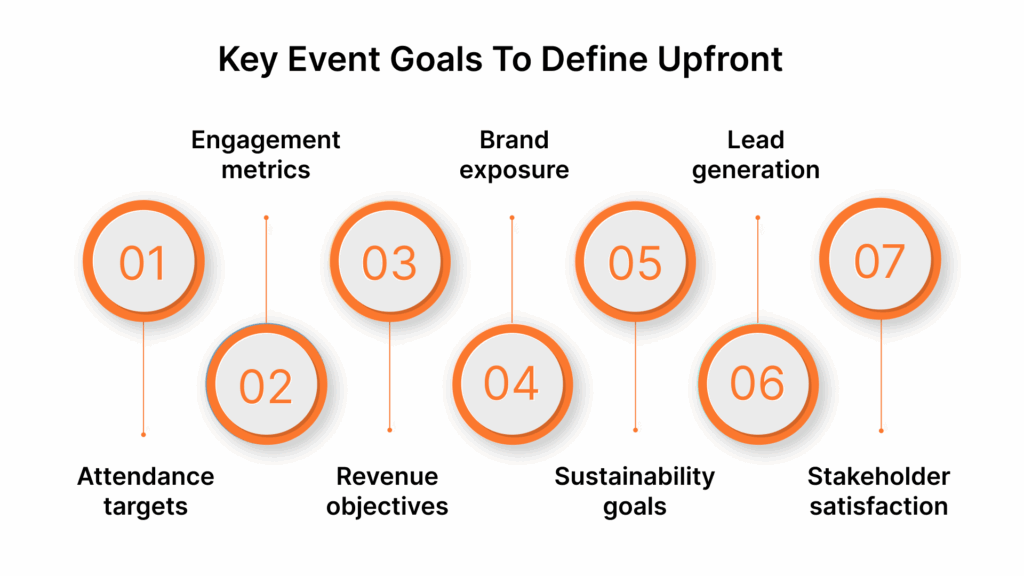
Attendance targets – Total registrations, check-ins, drop-off rates
Engagement metrics – Session participation, app usage, Q&A interactions, social media shares
Revenue objectives – Ticket sales, sponsorship income, upsells or donations
Brand exposure – Media coverage, mentions, awareness lift
Sustainability goals – Carbon footprint reduction, green logistics, paperless initiatives
Lead generation – Number of qualified leads, conversion rates post-event
Stakeholder satisfaction – Feedback from sponsors, team members, volunteers, and partners
Why These Goals Matter for Post-Event Analysis:
Setting goals is essential for measurement. If you can’t say what success looks like before the event, you won’t be able to evaluate it properly afterward. It allows you to:
Track performance with precision
Identify what exceeded, met, or fell short of expectations
Justify ROI to stakeholders with data
Connect outcomes directly to your team’s efforts
Build a stronger business case for future events and budgets
Also Read: A complete guide on how to plan an event
The next step is to collect the right data to evaluate whether those goals were achieved. With well-defined objectives in place, data collection becomes more purposeful and targeted.
Data Collection for Post-Event Analysis
Effective post-event analysis begins with purposeful data collection.
By casting a wide net across both quantitative and qualitative sources, you set yourself up for a detailed analysis. This ensures that every dimension of your event’s performance and attendee experience is reflected.
Essential Data Sources for Post-Event Analysis
Systematic collection of these data points ensures your post-event analysis is grounded in concrete evidence and enriched by real-world feedback.
Data Category | Description | Examples |
Registration and Attendance | Quantitative data capturing who registered and attended | Total registrations, check-ins, no-shows |
Participant Demographics | Information about attendee profiles to understand audience composition | Age, gender, location, industry |
Session/Activity Engagement | Measures of involvement during specific event parts | Session attendance, booth visits, app interactions |
Feedback | Qualitative input from various stakeholders | Surveys, interviews, testimonials |
Social Media and Online Engagement | Monitoring digital conversations and interactions connected to the event | Hashtag performance, mentions, shares, comments |
Financial Reports | Comprehensive tracking of event-related income and expenditures | Budget adherence, sponsorships, ticket sales |
Operational and Logistical Metrics | Data reflecting the efficiency of event operations and attendee flow | Crowd flow, check-in times, incident reports |
Sustainability Measures | Metrics on environmental impact and resource usage | Waste reduction, energy consumption, recycling rates |
How to Collect Data for Post-Event Analysis
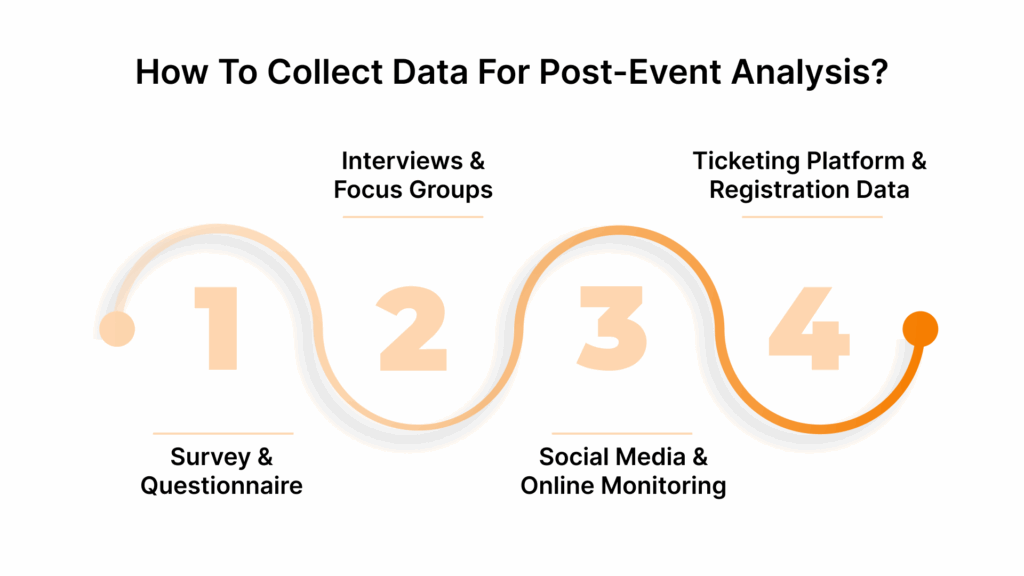
With a structured approach to data collection, you can uncover valuable insights that will help improve your future events. Below, we have mentioned the most common medium to collect data effectively.
1. Survey & Questionnaire
Surveys are one of the most effective and structured methods to collect feedback from attendees. They allow you to capture both quantitative data (ratings, multiple-choice questions) and qualitative data (open-ended responses).
How to Collect:
Send out post-event surveys immediately after the event ends to capture fresh feedback.
Use online survey tools like Google Forms, SurveyMonkey, or Typeform to create user-friendly questionnaires.
Ensure that the survey is short but comprehensive, covering key event aspects such as session quality, logistics, content relevance, and overall experience.
Ask questions that will help you assess attendee satisfaction, identify areas for improvement, and gauge the event’s impact on participants. Consider questions like:
“What was your favorite session and why?”
“How would you rate the overall event experience?”
“Was the event content relevant to your expectations?”
2. Interviews and Focus Groups
While surveys provide valuable quantitative data, interviews and focus groups offer deeper, qualitative insights into the attendee experience. They help you understand the “why” behind attendee opinions and can uncover nuances that surveys may miss.
How to Collect:
Conduct one-on-one interviews with a diverse sample of attendees, including both participants and stakeholders (e.g., sponsors, speakers).
Hold small focus groups (5-8 participants) to facilitate open-ended discussion about the event’s strengths and weaknesses.
Use video or phone calls for remote interviews or in-person meetings for more personal engagement.
3. Social Media and Online Monitoring
By monitoring social media platforms, you can capture attendee reactions, both positive and negative, and identify trending topics, hashtags, or buzzwords related to your event.
How to Collect:
Monitor social media platforms (Twitter, Instagram, LinkedIn, Facebook) for mentions of your event using your official hashtag or event name.
Use social media listening tools like Hootsuite, Brandwatch, or Sprout Social to track sentiment and analyze the volume of posts, shares, and comments.
Encourage attendees to post about their experience during and after the event using specific hashtags.
4. Ticketing Platform and Registration Data
Your event’s ticketing platform and registration data provide critical insights into attendee demographics, behavior, and preferences. This data can help you understand who attended, how they registered, and what influenced their participation.
How to Collect:
Use data from your ticketing and registration platforms to analyze attendee patterns.
Track registration trends, including early vs. late registrations, types of tickets purchased (VIP, general admission), and any add-ons like workshops or experiences.
Analyze demographic information such as age, gender, job titles, or geographic location if available.
With Wiz-Team’s integrated platform, collecting and analyzing real-time data from various sources like registration, attendee engagement, and feedback becomes effortless.

You’ve collected a wealth of data from your event. Now comes the exciting part: turning all those numbers, comments, and stats into insights that actually matter.
Transforming Event Data Into Meaningful Outcomes
Careful analysis of event data uncovers patterns, highlights successes, identifies weaknesses, and reveals opportunities that are often invisible at first glance.
Effective data analysis combines both quantitative metrics and qualitative feedback, enabling event professionals to understand not only what happened but why it happened.
Here are essential methods that elevate your post-event analysis from basic reporting to insightful decision-making:
1. Explore Performance Trends and Patterns
Analysis Method | Description |
Longitudinal Analysis | Track how key metrics (attendance, engagement, conversions) change over time to spot trends and cycles. |
Time-Series/Regression Analysis | Use statistical tools (moving averages, regression) to identify growth, plateaus, or declines in specific areas. |
Pattern Recognition & Anomaly Detection | Employ algorithms or visual inspection (charts, heatmaps) to uncover outliers and repeating behaviors. |
Comparative Analysis | Assess current event performance against past events or benchmarks to contextualize results. |
2. Satisfaction and Sentiment Analysis
Numbers are important, but feelings matter too.
Attendee satisfaction reveals whether your event met expectations, while sentiment analysis (including comments and social media buzz) uncovers the emotional story behind the data. To find that out, consider:
Survey Data Aggregation: Calculate averages/medians for satisfaction ratings, identify top/bottom scoring elements.
NPS & Qualitative Feedback: Quantify Net Promoter Score; thematically code open-ended feedback to extract common sentiment drivers.
Text & Sentiment Analysis: Apply tools to evaluate sentiment from social media, chat, and comment data for a broader emotional pulse.
How: Create visual sentiment maps, quote key comments, and compare satisfaction across attendee segments or sessions.
3. ROI Calculations for Organizers and Sponsors
Revenue and Cost Analysis: Calculate gross revenue, total expenses, and net profit specific to the event.
ROI Computation: Divide net gain by total investment to get a percentage return. For sponsors, track brand exposure, leads, and conversions attributed to their involvement.
Benchmarking: Compare event or sponsor ROI to previous campaigns or industry averages.
But ROI extends further; remember to consider indirect benefits like brand exposure, lead quality, and long–term partner value when measuring sponsor ROI.
4. Track Lead Generation and Conversion
Events often serve as powerful lead magnets, so measure how well yours did.
Funnel Analysis: Map the attendee journey from awareness to sign-up, on-site engagement, and post-event follow-up; track drop-off points and conversion rates.
Lead Quality Assessment: Segment leads by engagement level, demographics, or expressed intent.
Source Attribution: Analyze which marketing channels or sessions generated the highest quality leads.
How: Build conversion funnels and pie charts for visualizing pipeline efficiency.
5. Identifying the Most and Least Effective Sessions or Marketing Tactics
Not every part of your event will perform equally. Finding the winners and the underperformers is key. This insight helps you allocate resources better and tailor content to your audience’s preferences.
Combine attendance stats with engagement metrics like Q&A participation or poll responses. Cross-check with session ratings and qualitative feedback to get a rounded view. Look out for sessions with lower attendance or high drop-off rates; they might need rethinking.
Similarly, analyze promotional channels by tracking conversion and engagement rates.
6. Correlating Feedback With Attendance and Engagement
To fully understand your data, you need to connect the dots. Sometimes an activity with low attendance rates could still receive rave reviews from the few who participated, indicating niche but passionate appeal.
Cross-Tabulation: Match satisfaction or qualitative comments with respective demographic, session participation, or engagement data.
Segmentation Analysis: Identify if specific groups (e.g., first-time attendees, VIPs) provided higher satisfaction or lower engagement, and theorize why.
Behavior-Feedback Linkage: Find patterns where high/low engagement aligns with positive/negative feedback for actionable change.
Pro Tips for Your Post-Event Analysis Playbook
Look for stories in the numbers: Ask why trends and outliers exist, not just what they are.
Keep your goals in mind: Always come back to your event’s objectives to ensure analysis stays relevant and strategic.
Prioritize wisely: Focus on insights that will drive meaningful change, not just nice-to-knows.
Also Read: How to organise event logistics for flawless execution
With solid data in hand, it’s essential to follow best practices in reporting to present these findings clearly and strategically.
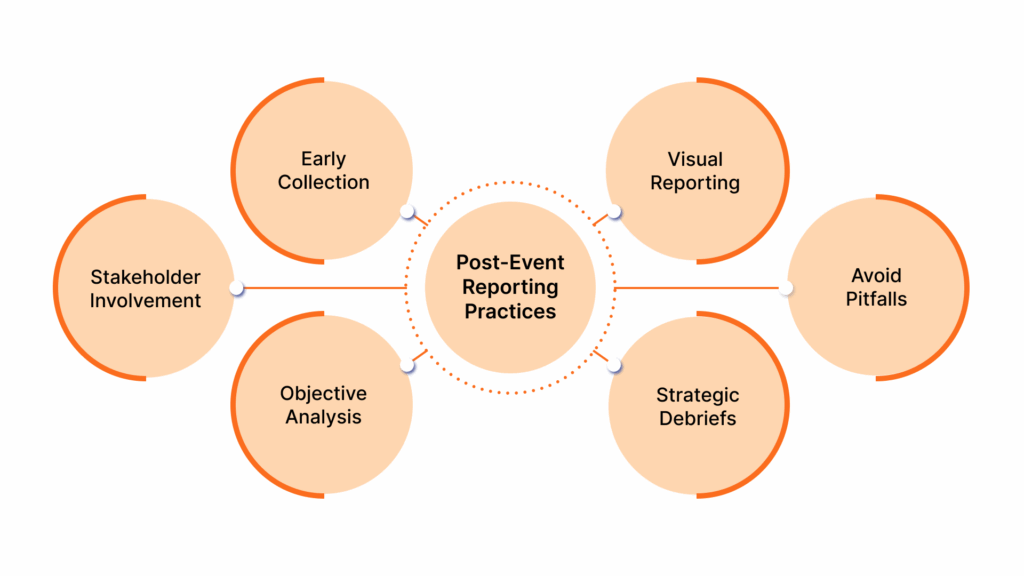
Post-Event Reporting Best Practices
By now, you know that post-event reporting is not a formality; rather, it has the power to build momentum for your next event.
Adopting these best practices will help you to keep your reports objective, comprehensive, and compelling, and ensure that valuable insights aren’t lost in the shuffle.
1. Start Collecting Data Early: Before, During, and After the Event
Waiting until after the event to gather data risks gaps, forgotten details, and lost opportunities.
Integrate data capture into all event phases through registration, on-site engagement (e.g., session attendance, polls), and follow-up surveys.
Use technology (apps, badge scans, social media monitoring) to collect real-time, rich datasets.
2. Involve All Stakeholders in Review and Discussion
Multiple perspectives uncover blind spots, enrich analysis, and build shared ownership of findings.
Include event planners, marketing, sales, sponsors, exhibitors, and even select attendees in review sessions.
Facilitate open, collaborative debriefs that encourage honest feedback and strategic conversation.
3. Maintain Objectivity and Thoroughness
Bias or partial data can distort insights and lead to poor decisions.
Use standardized metrics and clear benchmarks aligned with event objectives.
Validate data quality before drawing conclusions.
Balance quantitative data (numbers, KPIs) with qualitative feedback (surveys, interviews).
4. Use Visuals, Charts, and Clear Presentation Formats
Visual storytelling makes complex data digestible, memorable, and actionable.
Employ charts, infographics, heatmaps, and dashboards instead of dense text.
Keep visuals simple, focused, and relevant to the audience’s interests (executives want ROI; sponsors want brand exposure metrics).
Use narrative captions to connect visuals to strategic insights.
5. Avoid Common Pitfalls
Lack of Complete Data: Plan for comprehensive data capture to eliminate blind spots.
Subjective Interpretation: Challenge assumptions; rely on evidence and cross-checks.
Ignoring Stakeholder Feedback: Treat feedback as a critical data source, not an afterthought.
6. Organize Internal and External Debrief Meetings
Timely, structured discussions turn static reports into dynamic strategic conversations.
Hold internal debriefs soon after the event to gather lessons learned from the team.
Conduct external meetings with sponsors or key stakeholders to align on results and future plans.
Use these forums to encourage open dialogue and co-create actionable improvement plans.
Also read: The strategic value of Swag Bags in event planning
Next, it’s time to create an engaging presentation that resonates with executives, sponsors, and teams alike.
Designing Clear and Impactful Post-Event Reports
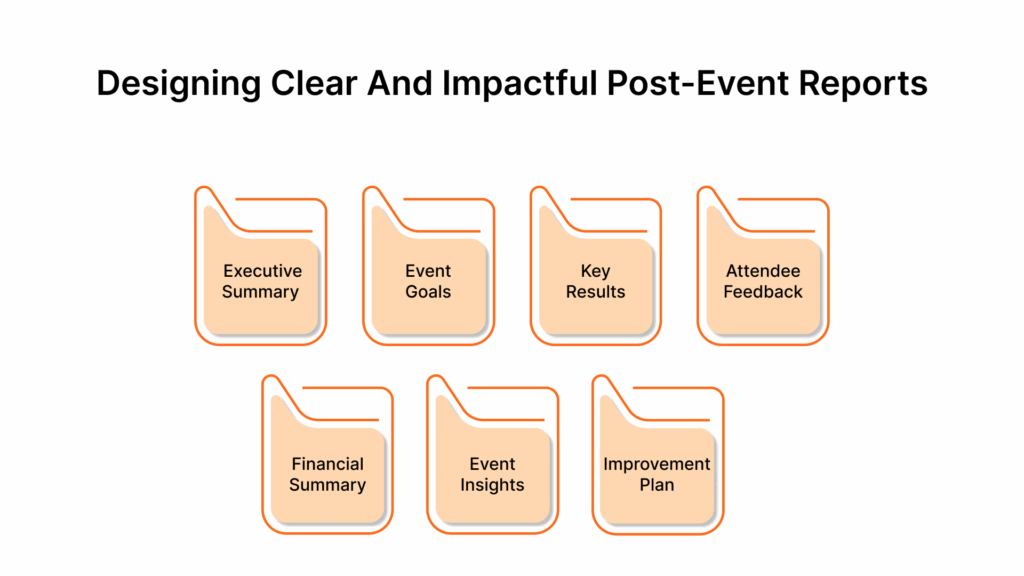
A well-structured post-event report is essential to capture your event’s story clearly and persuasively.
It gives your insights a direction by leading to meaningful improvements and shared understanding among all stakeholders.
Organize your report into these core sections for clarity and impact:
Step 1: Executive Summary
Start strong with a concise snapshot of key outcomes. Highlight major successes, challenges, and your top recommendations in just 1-2 paragraphs, so busy readers grasp the essentials quickly.
Step 2: Event Overview and Objectives
Set the stage by describing the event basics: name, dates, location or format, target audience, and the primary goals. This grounds the data in context and reminds readers what success looked like.
Step 3: Key Results and Metrics
Present the heart of your findings aligned with your objectives:
Attendance and engagement data
Session or activity performance
Satisfaction scores (e.g., NPS)
ROI and financial indicators
Step 4: Attendee and Stakeholder Feedback
This section provides insight into attendee satisfaction and stakeholder views, helping you understand their experiences.
What to Include:
Results from post-event surveys or polls.
Qualitative feedback from interviews or focus groups.
Stakeholder insights (e.g., sponsors, internal team members, speakers).
Tip: Highlight key trends in feedback—both positive and areas for improvement.
Step 5: Financial Summary
The financial performance of the event is crucial to assess its overall success. This section should give a clear picture of event expenses and revenue.
What to Include:
Total revenue (ticket sales, sponsorships, merchandise).
Breakdown of event expenses (venue, marketing, logistics, etc.).
ROI: Did the event generate more revenue than it cost to produce?
Step 6: Lessons Learned and Key Challenges
Reflect on what went well and what didn’t, including unexpected issues or operational hurdles. Identify root causes where possible to move beyond symptoms to solutions.
Be transparent about challenges, but also focus on how they will be addressed moving forward.
Step 7: Actionable Recommendations and Next Steps
End the report with clear, actionable recommendations based on the insights gathered from the event. This section should guide future event strategies and highlight areas for improvement.
What to Include:
Specific recommendations (e.g., improve event registration, change event format).
A timeline for implementing changes or improvements.
Next steps for planning future events based on feedback.
Tips for Turning Your Report into an Engaging Presentation
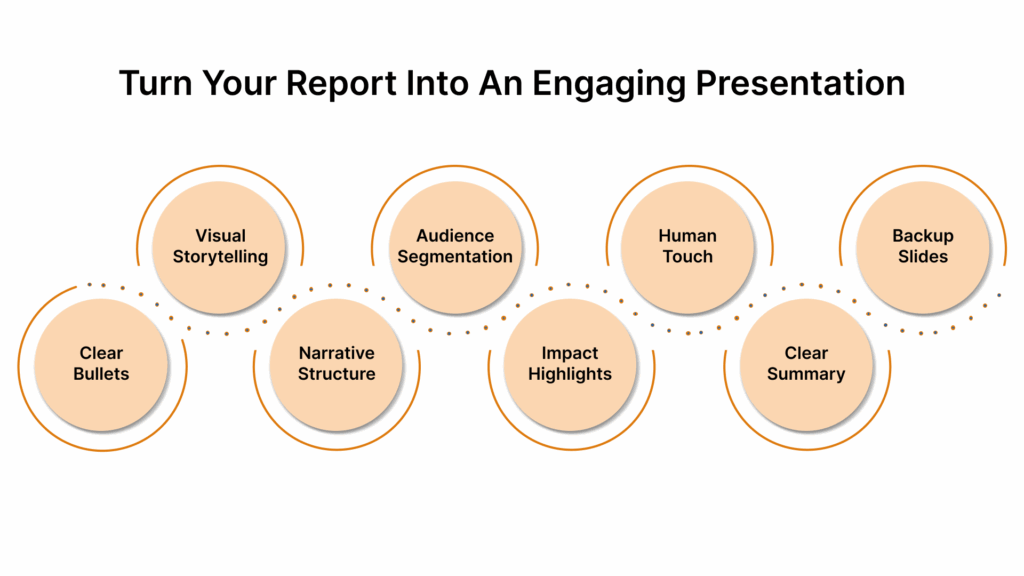
Your report is powerful, but a compelling presentation brings it to life for your audience. Here’s how to make your presentation clear, memorable, and motivating:
Prioritize Clarity and Brevity
Use simple bullet points focused on one key idea per slide. Avoid clutter and excessive text.
Use Visuals to Tell the Story
Replace dense tables with charts, infographics, and heatmaps that make data easy to understand at a glance. Use consistent colors and labels.
Create a Narrative Flow
Guide your audience through the event journey: objectives, successes, challenges, and strategic actions. Build momentum toward your recommendations.
Segregate Your Audience
Customize content to what matters to each group: executives want high-level ROI and strategic impact; sponsors focus on exposure and leads; operational teams seek logistical insights.
Highlight Impact with Emphasis
Use callouts, bold fonts, or color highlights for key metrics and actionable insights to draw attention.
Incorporate Quotes and Stories
Adding brief attendee or sponsor quotes humanizes your data and strengthens your message.
End with a Clear Summary and Next Steps
Reinforce the key takeaways and proposed actions to ensure decision-makers leave with a clear sense of direction.
Prepare for Questions
Have backup slides ready with detailed data and methodology to respond confidently during discussions.
Example Event Presentation Flow:
Introduction & Event Objectives
Attendance & Engagement Highlights
Satisfaction & Feedback Summary
Financial Overview
Challenges and Lessons Learned
Recommendations and Next Steps
Q&A and Additional Data (as needed)
While post-event reporting is crucial for success, streamlining this process is key for actionable insights. Wiz-Team offers a complete event management and analytics solution to effortlessly transform your data into strategic outcomes.
Wiz-Team: A Complete Event Management and Analytics Solution
Wiz-Team offers Event-Works, an all-in-one event management software designed by event professionals for event professionals.
Their platform enables real-time data capture, integration, and analysis, helping event organizers collect quantitative and qualitative data during all phases: before, during, and after events.
With Wiz-Team, you can:
Unify Your Data: Integrate registration, accreditation, real-time engagement, and post-event feedback in one platform for clearer, more actionable analysis.
Ensure Compliance and Security: Built-in controls keep participant data safe and help you confidently meet regulatory requirements.
Simplify Reporting: Automated dashboards and intuitive visuals let you communicate results quickly, freeing your team to focus on strategic decisions.
Scale with Flexibility: Whether a small workshop or a global summit, customize Wiz-Team to fit your event’s unique needs, no one-size-fits-all.

Conclusion
The process of post-event analysis and reporting opens a pathway to continuous evolution. It helps you anticipate attendee needs, optimize resources, and elevate every future event experience.
Embracing a mindset of curiosity and strategic reflection transforms each event from a standalone moment into a crucial step in a cycle of improvement.
Explore how Wiz-Team can simplify your event management with its modular platform, while turning your data into actionable insights that propel your events to new heights.
FAQs
1. How soon after an event should post-event analysis begin?
Ideally, post-event analysis starts immediately after the event concludes, while data and feedback are fresh, allowing timely insights to inform upcoming event cycles.
2. Who should be involved in the post-event analysis process?
Key stakeholders like event planners, marketing teams, sponsors, and sometimes even select attendees should collaborate to provide diverse perspectives and comprehensive evaluation.
3. How do you balance quantitative data with qualitative insights in post-event analysis?
Quantitative data offers measurable trends, while qualitative feedback reveals attendee emotions and experiences; merging both delivers a complete understanding of event impact.
4. What common challenges might arise during post-event analysis and how can they be mitigated?
Challenges include incomplete data, biased feedback, and lack of stakeholder engagement; these can be addressed by early data collection planning, using objective metrics, and fostering open communication.
5. Can post-event analysis influence real-time decisions for future events?
Yes, insights gained from one event can shape immediate adjustments in marketing, content, and logistics for upcoming events, making the analysis a dynamic, ongoing tool rather than a retrospective exercise.
#WizJourney